 ComingUp

Gallery
About
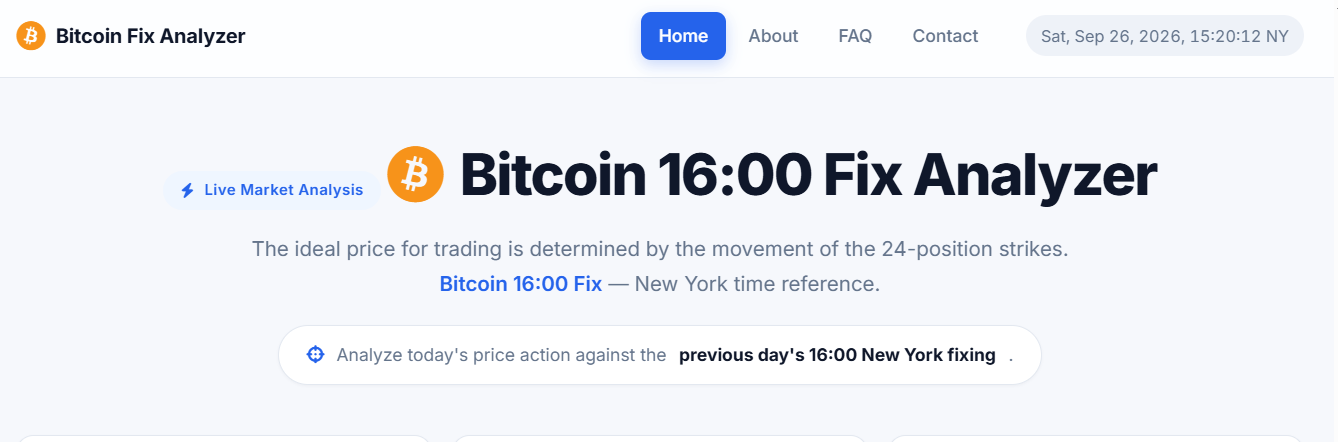
Bitcoin 16:00 Fix Analyzer is a browser-based analytical dashboard designed to study how the live Bitcoin price behaves relative to the previous day's 16:00 New York fixing, which is the institutional reference price published by the CME Group and used to settle Bitcoin futures contracts as well as to compute the Net Asset Value of spot Bitcoin exchange-traded funds. The site is not a demo, it is a working tool that retrieves real market data from public sources and produces a structured reading of price action around an institutional benchmark. Its purpose is to give traders, analysts and researchers a clean visual framework to interpret how the current session is positioning itself against the most recent settled fixing window, which acts as a slow-moving magnet for options dealers, ETF desks and institutional order flow.The tool operates entirely in the browser and requires no installation, no account, no backend and no build step. It is composed of three self-contained files, an HTML document that defines the four pages of the site, a CSS stylesheet that controls the light professional fintech appearance, and a JavaScript file that handles data retrieval, calculation, chart rendering and page routing. Everything runs client-side, which means the user never sends data to any server, never exposes an API key and never depends on a proprietary platform to view the analysis. The interface refreshes automatically, with the live spot price updating every five seconds and the historical series used for the charts and for the fix extraction updating every five minutes.The home page opens with a large central title and a subtitle that states the core idea of the tool, namely that the ideal price for trading is determined by the movement of the twenty-four position strikes, and that the Bitcoin sixteen hundred fix is the New York time reference for this analysis. Below the hero, three summary cards display the key metrics of the current session. The first shows the average price of Bitcoin over the last twenty-four hours. The second shows the difference, in US dollars, between the live spot price and the previous day's fix, coloured green when the price is above the fix and red when it is below. The third shows the range, that is the difference between the highest and the lowest price recorded over the last twenty-four hours. These three values give an immediate sense of where the market stands relative to its institutional anchor.In the centre of the home page, a large card displays the live Bitcoin to US dollar price with a live badge, the twenty-four hour percentage change and the previous day's sixteen hundred New York fixing price, labelled as the CME benchmark. The price uses tabular numerals so that digits do not shift as they change, and the card adopts a soft gradient background that keeps the visual hierarchy clear without distracting from the number itself. This is the value the user is meant to read first, and everything else on the page is contextual information built around it.Immediately below the live price card, the trading levels ladder shows the full set of derived levels built around the previous day's fix. The ladder starts with the fix itself, which is displayed full width as the anchor of the structure. Above it, four levels are shown at plus zero point two five percent, plus zero point five zero percent, plus zero point seven five percent and plus one point zero zero percent, each with its precise dollar value. Below it, the four corresponding negative levels are shown at minus zero point two five percent, minus zero point five zero percent, minus zero point seven five percent and minus one point zero zero percent. Whenever the live spot price has already crossed one of these levels, the corresponding card is highlighted in amber with a small diamond marker on the top right corner, so the user can see at a glance which of the strikes are currently in play and which remain untouched. The levels are purely mathematical offsets from the fix and are presented as a structural reading of where options positioning and institutional order flow tend to cluster, not as signals or predictions.The home page then presents two interactive charts rendered with Chart.js. The first chart shows the Bitcoin to US dollar spot movement over the last twenty-four hours, drawn as a smooth line with a soft blue gradient fill, hover tooltips showing the exact price, and a right-aligned y-axis formatted in US dollars. The second chart is the Daily Delta versus the previous sixteen hundred New York fixing. This chart plots the percentage difference between each intraday price point and the fix, using green bars for values above the fix and red bars for values below it. The Delta chart is the analytical counterpart of the level ladder, because it shows how the session has been moving relative to the institutional anchor throughout the day, and it makes it easy to see whether the market has been trading at a premium or at a discount to the fix.The About page explains in detail what the Bitcoin sixteen hundred fix is, why it matters, and how this specific analyzer works. It clarifies that the fix is the daily reference price determined during the fixing window that ends at sixteen hundred New York time, published by the CME Group and used to settle Bitcoin futures and to compute the NAV of spot Bitcoin ETFs. It also explains that the tool derives its trading levels from the previous day's fix because that is the most recent settled and institutionally recognised benchmark, and that using it as an anchor is exactly how dealers, ETF desks and options market makers structure their positioning. The page then walks through the three metrics shown on the home page, describing what the average, the difference from the fix and the range actually represent, and closes with a short note on why the previous day's fix is such a powerful reference throughout the current session.The FAQ page collects seven expandable questions that cover the most common points of confusion. It explains what the Bitcoin sixteen hundred fix is, why the previous day's fix is used rather than the current one, how the trading levels are calculated, what the Daily Delta chart shows, how often the data refreshes, whether the site provides financial advice, and whether the levels can be used for automated trading. Every answer is written to be transparent about the scope of the tool and to reinforce the idea that the levels are mathematical offsets and not predictive signals.The Contact page offers a simple form with fields for name, email, subject and message, and a submit button that confirms the message has been sent on the client side. It also lists the project email address and website for direct contact. No message is actually transmitted to a server in the current version, and the form is intended as a placeholder for future integration with a backend or a form provider.At the bottom of every page, the footer contains four sections. The first section, titled What This Site Does, explains in plain language what the tool is, how it uses the previous day's sixteen hundred New York fix, how the trading levels are derived, what the charts show, and what the tool is not. The second section, titled Built With, lists the technologies used to build the site, namely HTML5, CSS3, JavaScript, Chart.js, Bitcoin data and the idea of being made to utilise. The third section contains the detailed financial disclaimer, which states clearly that the website is not an investment recommendation, not financial advice and not an analysis service, that all content is provided for informational, educational and research purposes only, that the levels are purely mathematical offsets and not predictive signals, that trading cryptocurrencies involves substantial risk including the loss of the entire invested capital, that market data may be delayed or inaccurate, and that the user is solely responsible for their own investment decisions. The fourth section is a simple copyright line with the project name and version.Visually, the site adopts a light and professional fintech aesthetic. The background is a very soft off-white, the cards are pure white with subtle shadows and rounded corners, and the accent colour is a calm institutional blue used consistently across buttons, links and highlights. Green and red are reserved exclusively for price direction and for the Delta chart bars, while amber is used only to mark levels that have been reached by the spot price. The typography is Inter, a modern sans-serif designed for interface readability, and the entire layout is responsive, adapting cleanly to tablets and phones with reflowed grids, horizontally scrollable navigation and charts that adjust their height to the viewport. The result is a tool that feels closer to a professional market dashboard than to a personal website, and that remains easy to read for hours at a time without fatigue.
Comments (1)
looks like a neat tool for tracking bitcoin price against that NY fixing time, how accurate is the data?
Related Products

FlipTracker
Budget and profit tracker built for real estate fix-and-flip investors.

Sumyfi
Track all your money in one dashboard.

InvoiceBlink | Free Invoice Generator
Create and send professional invoices in seconds

Slated
Invoice studio for freelancers: templates, live preview, clean PDFs.
StockDigging
A free global stock screener — US + Korea today, expanding worldwide.
smart-invoice-ai
Smart Invoice AI is a production-ready SaaS that lets freelancers